Validation methodology
MVS is validated using three validation methods: conceptual model validation, model verification and operational validity.
Conceptual model validation consists of looking into the underlying theories and assumptions. Therefore, the conceptual validation scheme includes a comprehensive review of the generated equations by the oemof-solph python library (see Economic Dispatch and Energy Balance Equation) and the components’ models. Next step is to try and adapt them to a sector coupled example with specific constraints. Tracing and examining the flowchart is also considered as part of this validation type, which is presented in Multi-vector simulator. The aim is to assess the reasonability of the model behavior through pre-requisite knowledge; this technique is known as face validity.
Model validation is related to computer programming and looks into whether the code is a correct representation of the conceptual model. To accomplish this, static testing methods are used to validate the output with respect to an input. Unit tests and integration tests, using proof of correctness techniques, are integrated within the code. Unit tests target a single unit such as an individual component, while integration tests target more general parts such as entire modules. Both test types are implemented using pytest for the MVS, their evaluation is automatized and they are executed with each change of the MVS. The unit tests are further described in Unit and integration tests.
Operational validity assesses the model’s output with respect to the required accuracy. In order to achieve that, several validation techniques are used, namely:
Graphical display, which is the use of model generated or own graphs for result interpretation. Graphs are simultaneously used with other validation techniques to inspect the results. This technique was regularly applied within the MVS developing process, especially with the help of real use cases from the E-LAND pilot sites.
Benchmark testing, through which scenarios are created with different constraints and component combinations, and the output is calculated and compared to the expected one to evaluate the performance of the model. The applied benchmark tests are described in Benchmark tests.
Extreme scenarios (e.g., drastic meteorological conditions, very high costs, etc.) are created to make sure the simulation runs through and check if the output behavior is still valid by the use of graphs and qualitative analysis.
Comparison to other validated model, which compares the results of a case study simulated with the model at hand to the results of a validated optimization model in order to identify the similarities and differences in results. Further information are provided in Comparison to other models
Sensitivity analysis, through which input-output transformations are studied to show the impact of changing the values of some input parameters. An example is provided in Sensitivity analysis verification tests
Additionally to the presented validation tests, a couple of input verification tests are implemented in the pre-processing module C0 and a number of output verification tests in E4 (see Automatic output verification).
The validation process of the MVS was identified and defined within the master thesis (El Mir, 2020). The evaluation of extreme scenarios and senstivity analysis was conducted for that thesis only, they are not repeated for each MVS release.
Unit and integration tests
To make sure that the MVS works correctly from a programming perspective, its functions need to be tested by unit tests, while its modules should be tested with integration tests. To automatize the testing process, the tests are implemented as pytest functions, which also allows to test the test coverage with coveralls. They also ensure that the tested existing functionalities do not cease to work properly as new code is introduced in the continuous development of MVS, as each proposed pull request must first pass all existing tests. The unit and integration tests can be found in the folder tests of the MVS github repository . Each of the files represent tests for one of the codebase modules (e.g., A0, A1, B0, etc.), and are named respectively: as such, the test file for the codebase module C2_economic_functions is named test_C2_economic_functions.
As of MVS release 0.5.5, the unit tests covered 74% of the code lines of the MVS. The benchmark tests, which also also include integration tests, increase this coverage to 91%.
Benchmark tests
A benchmark is a point of reference against which results are compared to assess the operational validity of a model. Benchmark tests are also automated like unit and integration tests, hence it is necessary to check that they are always passing for any implemented changes in the model. A list of selected benchmark tests, which cover several features and functionalities of the MVS, are listed here below. The list is not exhaustive, some additional tests are provided in tests.
Electricity Grid + PV (data/pytest): Maximum use of PV to serve the demand and the rest is compensated from the grid
Electricity Grid + PV + Battery (data/pytest): Reduced excess energy compared to Grid + PV scenario to charge the battery
Electricity Grid + Diesel Generator (data/pytest): The diesel generator is only used if its LCOE is less than the grid price
Electricity Grid + Battery (data/pytest): The grid is only used to feed the load
Electricity Grid + Battery + Peak Demand Pricing (data/pytest): Battery is charged at times of peak demand and used when demand is larger
Electricity Grid (Price as Time Series) + Heat Pump + Heat Grid (data/pytest): Heat pump is used when electricity_price/COP is less than the heat grid price
Maximum emissions constraint: Grid + PV + Diesel Generator (data: set 1, set 2, set 3/pytest): Emissions are limited by constraint, more PV is installed to reduce emissions. For RE share of 100 % in grid, more electricity from the grid is used
Parser converting an energy system model from EPA to MVS (data/pytest)
Stratified thermal energy storage (data/pytest): With fixed thermal losses absolute and relative reduced storage capacity only if these losses apply
Net zero energy (NZE) constraint: Grid + PV and Grid + PV + Heat Pump (data set 1, set 2, set 3, set 4/pytest): Degree of NZE >= 1 when constraint is used and degree of NZE < 1 when constraint is not used.
Note
Benchmark test input data is available in the codebase folders within tests/benchmark_test_inputs. It can also be used as simple example cases to get to know the MVS. The benchmark test assertions are provided as pytests in a number of files in tests with the naming convention test_benchmark_*.
Sensitivity analysis verification tests
Sensitivity analysis can determine whether a model behaves as expected regarding changes of the model inputs. For the MVS, a sensitivity analysis was performed in (El Mir, 2020, p. 54f) regarding the effect of changing the value of the feed-in tariff (FIT), combined with an energy generation asset with constant marginal costs of generation less then the electricity price. Below graph visualizes the relation of installed PV capacity and FIT, indicating that a FIT larger then the marginal costs of generation leads to an installation of the maximum allowed capacity (maximumCap):
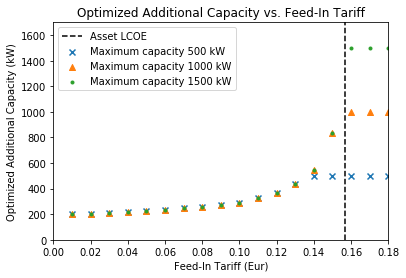
The graph underlines the use of the graphical displays validation technique for model verification. It is not an automatized output of the MVS, but indicates that such tests would also be appropriate to translate into benchmark tests.
Other input-output transformations that could be used for sensitivity analysis tests are:
Fuel price or generator efficiency variation around a point where the fuel price or generator efficiency is equal to electricity price or transformer efficiency of the electricity grid.
Peak demand price variation around a point where generator dispatch could avoid consumption from the grid at times of peak demand, thus avoiding peak demand pricing expenditures
Comparison to other models
A comparison of the results of different models regarding an identical reference system is a validation method that is commonly used. However, one model cannot absolutely validate another model or claim that one is better than the other. This is why the focus should rather be on testing the correctness, appropriateness and accuracy of a model vis-à-vis its purpose. Since the MVS is an open source tool, it is important to use a validated model for comparison, but also similar open source tools like urbs and Calliope for instance. The following two articles list some of the models that could be used for comparison to the MVS: (Ringkjøb, 2018) and (Bloess, 2017). A thorough comparison to other models able to perform optimizations for sector-coupled energy systems is something that should be performed in the future.
So far, the MVS has been compared to HOMER for a sector coupled energy system combining electricity and hydrogen sectors. This comparison was able to highlight the similarities and differences between the two optimization models. On the electricity side, most of the values are comparable and within the same range. The differences mainly arise on the hydrogen part in terms of investment into electrolyzer capacity, i.e. the component linking the two sectors, as well as related values. The calculation of the levelized cost of a certain energy carrier appear very different, which, however, was expected due to the energy carrier weighting approach: Using this, the costs of the energy system are attributed to the different energy sectors based on their respective share of the total electricity equivalent demand (compare Costs attributed to a specific sector (attributed_costs), Levelized costs of electricity equivalent (levelized_costs_of_electricity_equivalent)), whereas Homer is likely to assign the costs of the assets based on their output energy carrier. Details regarding the comparison drawn between the two models can be found in (El Mir, 2020, p. 55ff).
Automatic output verification
In addition to the aforementioned validation tests, a couple of verification tests are implemented. They serve as a safeguard against issues that indicate noteworthy misbehaviour of the model, and are tested with each MVS execution. Some of the issues are fatal issues that the users need to be protected against, others indicate possible unrealistic system optimization (and input) results. The tests are provided in the MVS codebase module E4_verification.
Following test serves as an alert to the energy system modeler to check their inputs again:
Excessive excess generation: Certain combinations of inputs can lead to excessive excess generation on a bus, for example if PV panels itself are very cheap compared to electricity input, while inverter capacity is very expensive. The test
E4.detect_excessive_excess_generation_in_busnotifies to user of optimal but overly high excess generation of a bus within the energy system. Excess generation is defined to be excessive, if the ratio of total outflows to total inflows is less than 90%. The test is applied to each bus individually. The user should check the inputs again and potentially define amaximumCapfor the generation asset at the root of the problem.
Following tests ensure that introduced constraints where applied correctly:
Adherence to maximum emissions constraint: With the maximum emission constraint the user can define the maximum allowed emissions in the energy mix of the optimized energy system. The test
E4.maximum_emissions_testruns a verifies that the constraint is adhered to.Adherence to minimal renewable share constraint: Test
E4.minimal_renewable_share_testmakes sure that the user-defined constraint of the minimal share of renewables in the energy mix of the optimized system is respected.Adherence to net zero energy constraint: If the user activated the net zero energy constraint, the test
E4.net_zero_energy_constraint_testmakes sure that the optimized energy system adheres to it.Adherence to realistic SOC values: Test
E4.verify_state_of_chargemakes sure that the timeseries of the state of charge (SOC) values for storages in the energy system simulation results are within the valid interval of![[0,1]](../_images/math/a7b17d1c3442224393b5a845ae344dbe542593d7.png) . A SOC value out of bounds is physically not feasible, but can occurr when the optimized storage capacity is so marginal that it is in the range of the precision limit of the MVS.
. A SOC value out of bounds is physically not feasible, but can occurr when the optimized storage capacity is so marginal that it is in the range of the precision limit of the MVS.
Note
If there is an ERROR displayed in the log file (or the automatic report), the user should follow the instructions of the error message. Some will require the user to check and adapt their input data, others will indicate serious misbehaviour.
A WARNING in the log file (or the automatic report) is important information about the perfomed system optimization which the user should be aware of.