Multi-vector simulator
The Multi-Vector Simulator (hereafter MVS) is an oemof -based Python package which aims at facilitating the modelling of multi-energy carriers energy systems in island or grid connected mode.
The main goals of the MVS are
to minimize the production costs by determining the generating units’ optimal output, which meets the total demand
to optimize near-future investments in generation and storage assets with the least possible cost of energy.
The MVS graphical model is divided into three connected blocks that trace the logic sequence: inputs, system model, and outputs. This is a typical representation of a simulation model:
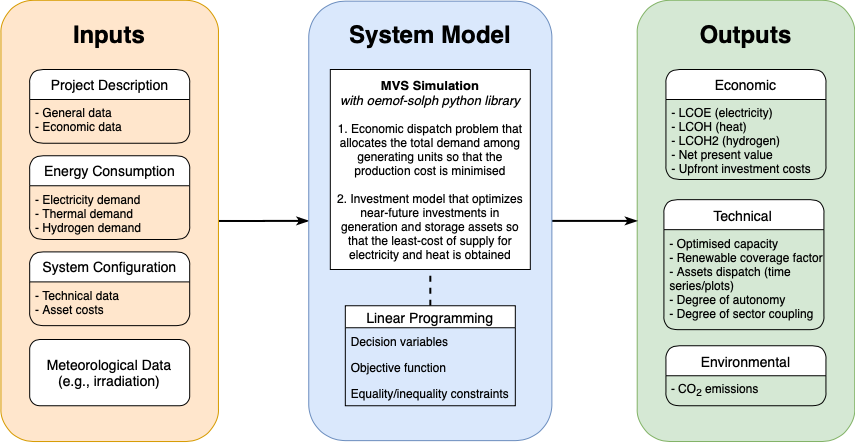
The user is asked to provide the required data via a collection of csv files or a unique json file with particular format. The input data is split into the following categories:
Project description, which entails the general information regarding the project (country, coordinates, etc.), as well as the economic data such as the discount factor, project duration, or tax
Energy consumption, which is expressed as times series based on the type of energy (in this case: electrical and thermal)
System configuration, in which the user specifies the technical and financial data of each asset
Meteorological data, which is related to the components that generate electricity by harnessing an existing source of energy that is weather- and time-dependent (e.g., solar and wind power)
This set of input data is then translated to a linear programming problem, also known as a constrained optimization problem. The MVS is based on the oemof-solph python library that describes the problem by specifying an objective function to minimize the annual energy supply costs, the decision variables and the bounds and constraints.
The simulation outputs are also separated into categories:
Economic results used for the financial evaluation, such as the levelized cost of electricity/heat or the net present value of the projected investments
Technical results that include the optimized capacities and dispatch of each asset
Environmental results assessing the system’s environmental contribution in terms of CO2 emissions.
Additionally, different vizualizations of the results can be provided, eg. as pie charts, plots of asset dispatch and an automatic summary report.
Maintainers
The multi-vector simulator is currently maintained by staff from Reiner Lemoine Institute.
The MVS is developed as a work package in the European Union’s Horizon 2020 Research E-LAND project
- Acknowledgement:
This project has received funding from the European Union’s Horizon 2020 Research and Innovation programme under Grant Agreement No 824388.
- Disclaimer:
The information and views set out in this document are those of the author(s) and do not necessarily reflect the official opinion of the European Union. Neither the European Union institutions and bodies nor any person acting on their behalf may be held responsible for the use which may be made of the information contained herein
Getting Started
Follow the Quick start guide
Model Reference
How the energy system is modelled: Assumption behind the model | Available components for modelling | Setting constraints on model or components | Scope and limitation of the model
Description of parameters: Input parameters | Output variables and KPIs
Validation of the model: Validation methodology
API Reference
Documentation: Modules and functions
Getting involved: Contributing guidelines and protocols
Academic references: Publications and Bibliography
Using or modifying MVS: License | How to cite MVS
Getting help: Know issues and workaround | Report a bug or issue